Digital Weather Graph
Since 2016 I've had this dream of creating an electromechanical sculpture that shows the forecasted temperature using a physical string. I created a digital version of that line graph so that I could get a feel for whether or not it was a good way for displaying the temperature forecast. It turns out that it is! Viewing the weather in this format works for me and I use it every day.
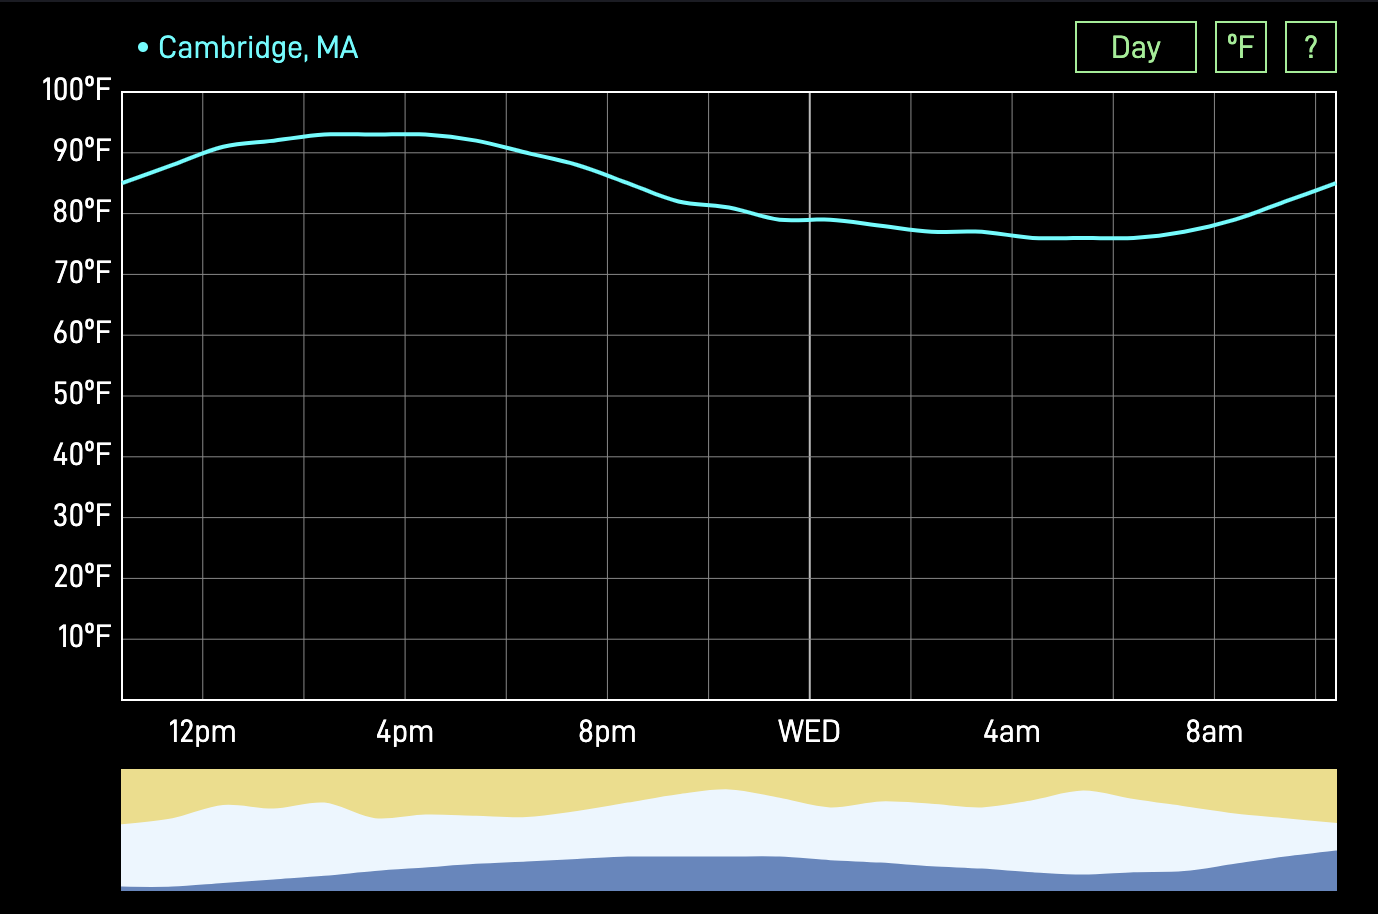
Here's a screenshot of how the graph appeared on 2024-07-09 at 10:23:
Features
The weather graph supports the following:
- Plot Forecasted Temperature as Line Graph
-
Choose Forecast Duration: Day, 2 Day, or Week
- Cycle using the keyboard shortcut "d"
-
Toggle Temperature Unit: Fahrenheit or Celcius
- Toggle using the keyboard shortcut "u"
- Update Forecast every 60 Seconds
-
Save Configuration in URL Query Parameters
- See below for details.
-
Set Location to Anywhere in the United States
- See below for details.
-
View Forecasted Weather Conditions
- Yellow means percent chance of sunshine
- Gray means percent chance of clouds
- Blue means percent chance of precipitation
- Resize Graph when Window Size Changes
Configure using URL Query Parameters
When you make changes in the interface, the URL is updated to reflect your changes. This way, you can bookmark the URL so that it's always configured how you like. Here are the options:
-
Temperature Unit
- Parameter Name: unit
- Values: ºF, ºC
-
Forecast Duration
- Parameter Name: duration
- Values: Day, 2 Days, Week
-
Hide Conditions Graph
- Parameter Name: hide_conditions_graph
- Values: true, false
-
Hide Header
- Parameter Name: hide_header
- Values: true, false
-
Place
- Parameter Name: place
- See below for details.
For example, here is a URL that shows the weekly forecast in ºC for Miami, FL and hides the header and conditions:
/weather?place=Miami,+FL;cyan;MFL;110;50&hide_conditions_graph=true&hide_header=true&duration=Week
Set Location
Forecast data comes from the United States Weather.gov API Web Service, so the forecast can only be displayed for locations in the United States.
The National Weather Service divides the United States into a series of overlapping grids that can be used to access detailed weather forecast data. Each grid is identified by a unique GRID_ID which represents a specific forecast area. Specific locations within these grids can be pinpointed using a coordinate system where GRID_X represents the position along the east-west axis and GRID_Y represents along the north-south axis.
To determine these values for a location within the United States, follow these steps:
- Go to https://www.weather.gov/documentation/services-web-api
- Navigate to the Specification tab
- Scroll down to the /points/{point} endpoint
- Click the endpoint to expand it
-
Click Try it out, then enter the latitude and longitude into the point input
- Join the latitude and longitude using a comma, like 42.388,-71.135
- Click Execute
-
Scroll down to Response body and find your values within the properties object
- gridId
- gridX
- gridY
The location can be set using the name query parameter in the following format: place=PLACE_NAME;LINE_COLOR;GRID_ID;GRID_X;GRID_Y where the values have the following meaning:
- PLACE_NAME: The name of the place (which can be anything and is simplify displayed in the interface).
- LINE_COLOR: The color to use when plotting the temperature forecast.
- GRID_ID: The weather forecast grid.
- GRID_X: The x-coordinate of a point within the weather forecast grid.
- GRID_Y: The y-coordinate of a point within the weather forecast grid.
For example, this URL will show the forecast for Central Park in New York City using a yellow line:
-
/weather?place=Central Park;yellow;OKX;34;38
- Coordinates: 40.772,-73.973
- Grid_ID: OKX
- Grid_X: 34
- Grid_Y: 38
Implementation Details
The weather graph is made using SVG that is controlled using Javascript. The code is written in Typescript and is bundled using Webpack. Its only dependencies are d3 and axios. Weather forecast data comes from the United States National Weather Service.
History
I created the first version of this graph back in 2022 using Vue.js, but then wanted to simplify the code (and write it in Typescript) so I reimplemented it in 2024 and made changes to the design.
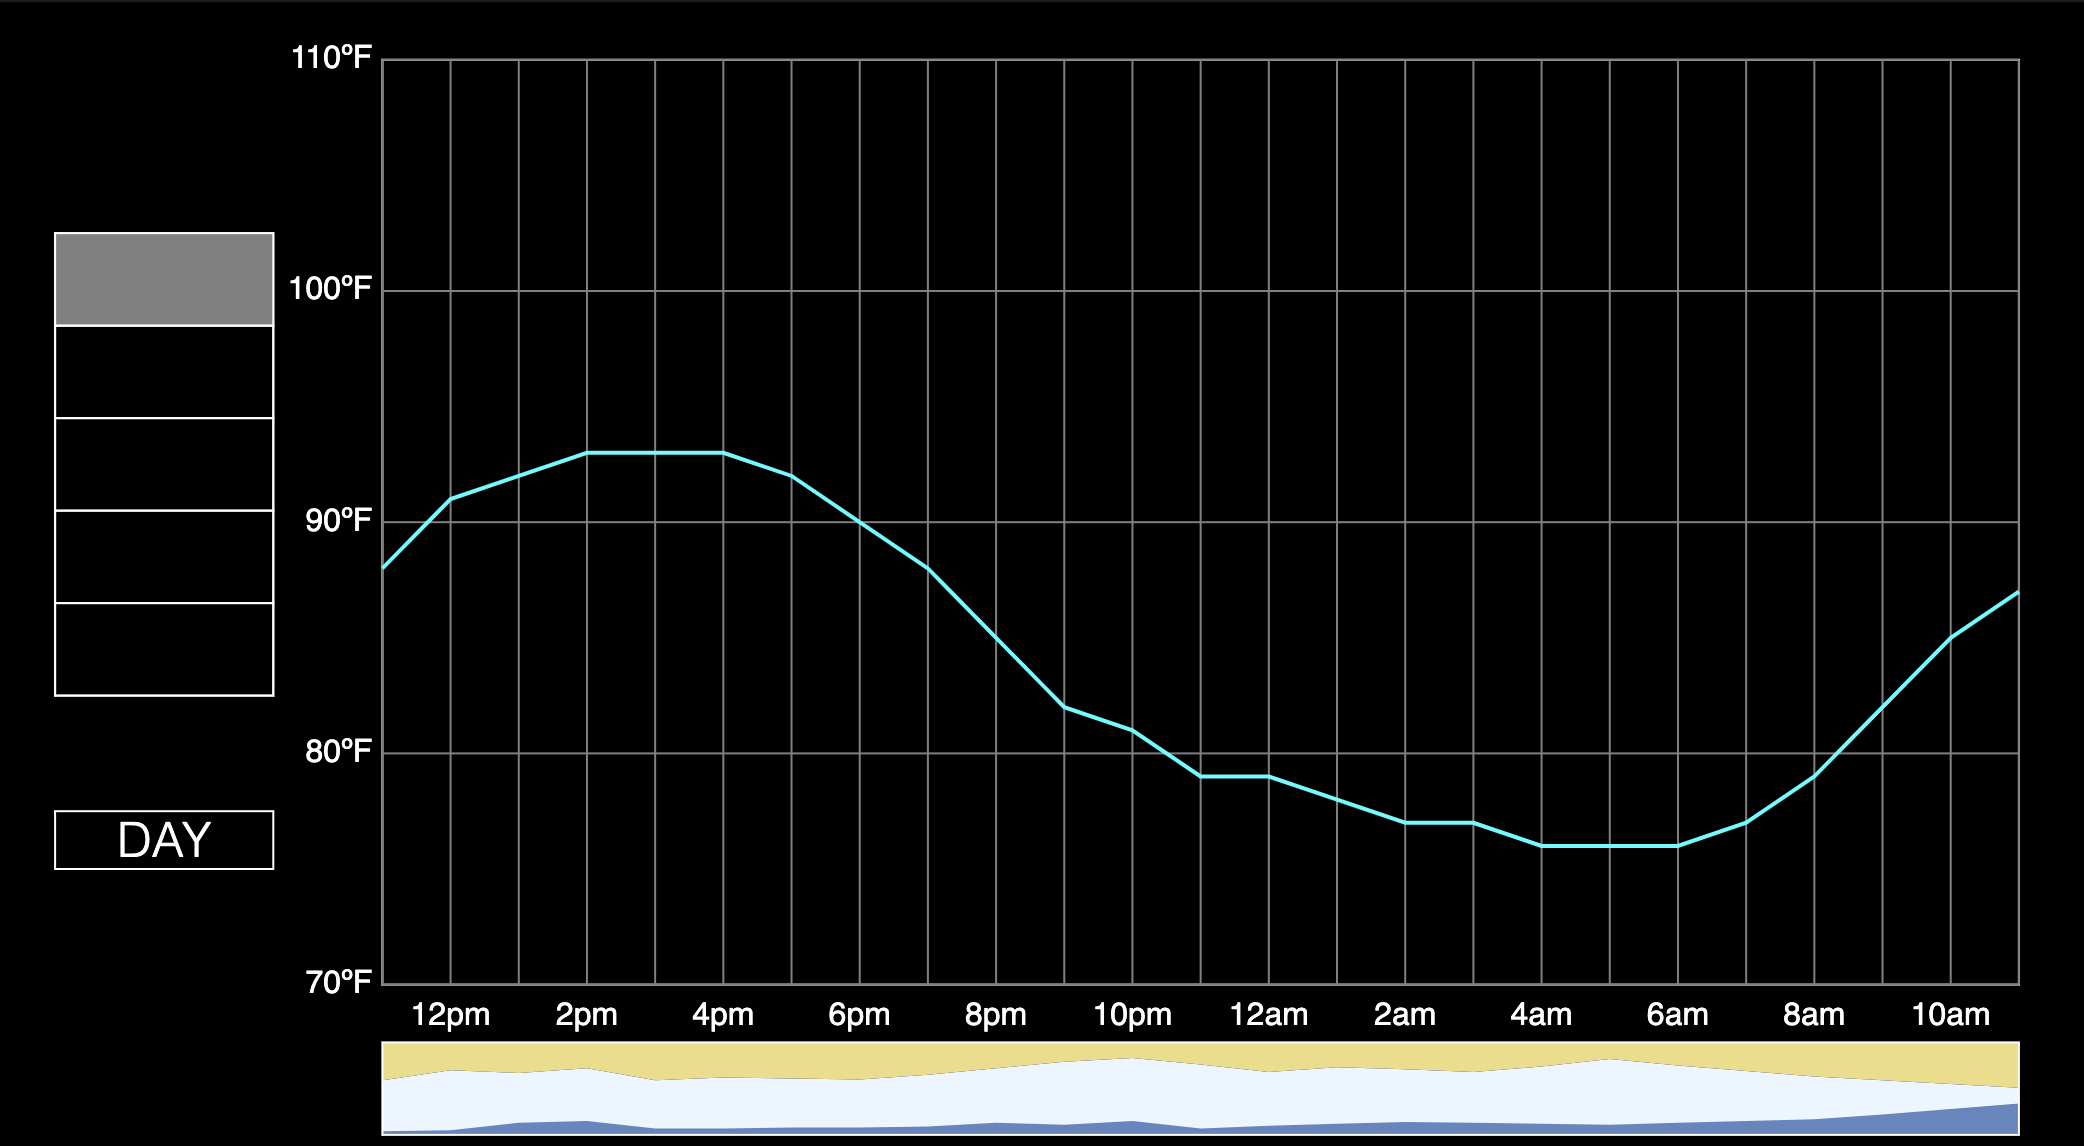
Here's a screenshot of the old graph showing the forecast on 2024-07-09 at 11:43